At the Mauna Loa CO2 Observatory, the Week to Week 10 Year Comparator Is the 3rd Highest Ever. [View all]
As I've indicated repeatedly in my DU writings, somewhat obsessively I keep a spreadsheet of the weekly data at the Mauna Loa Carbon Dioxide Observatory, which I use to do calculations to record the dying of our atmosphere, a triumph of fear, dogma and ignorance that did not have to be, but nonetheless is, a fact.
Facts matter.
When writing these depressing repeating posts about new records being set, reminiscent, over the years, to the ticking of a clock at a deathwatch, I often repeat some of the language from a previous post on this awful series, as I have been doing here with some modifications. It saves time.
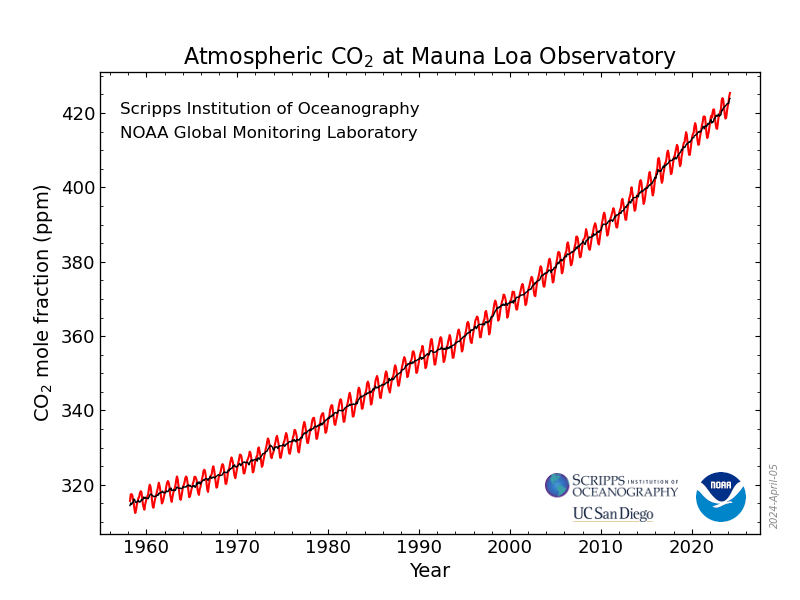
As I note in this series of posts, the concentrations of the dangerous fossil fuel waste carbon dioxide which are killing the planet fluctuate sinusoidally over the year, with the rough sine wave superimposed on a quadratic axis:

Monthly Average Mauna Loa CO2
About two months ago we hit the autumnal local minimum for 2023, 418.29 ppm; the concentrations will rise until May or June. We may reasonable expect readings well in excess of 426 ppm, since we are doing nothing at all to address climate change.
There is considerable noise in these readings, and a way of leveling them is to look at the data over a 10 year period, which the observatory reports along with week to week comparators in the previous year.
Here is the current report of weekly data at the observatory:
Week beginning on November 19, 2023: 421.21 ppm
Weekly value from 1 year ago: 418.38 ppm
Weekly value from 10 years ago: 395.26 ppm
Last updated: November 26, 2023
Weekly average CO2 at Mauna Loa (Accessed 11/26/2023)
The comparator with week 46 of 2022 is a relatively modest 2.83 ppm higher; the average for 2023 for week to week comparators to 2022 is 2.55 ppm, with four readings being in the top 50 out of 2495 weekly readings in my spreadsheet, the highest being 4.40 ppm recorded in the week beginning 7/23/2023 (the ninth highest of all).
For this week it is the comparator with week 46 of 2013 that is remarkable. It is 25.95 ppm higher in 2023, the third highest of all such comparators going back to 1984. All of the top 50 ten year week to comparators have taken place since 2019 (when there were two), with 11 of these in 2023, and 16 in 2022.
Things are getting worse faster than ever.
People can lie, to each other and to themselves, but numbers don't lie.
Have a pleasant Sunday.
