Showing Original Post only (View all)
Warning! This "Colorful Chart" is Censored by IPCC - James Hansen, Pushker Kharecha and Dylan Morgan [View all]
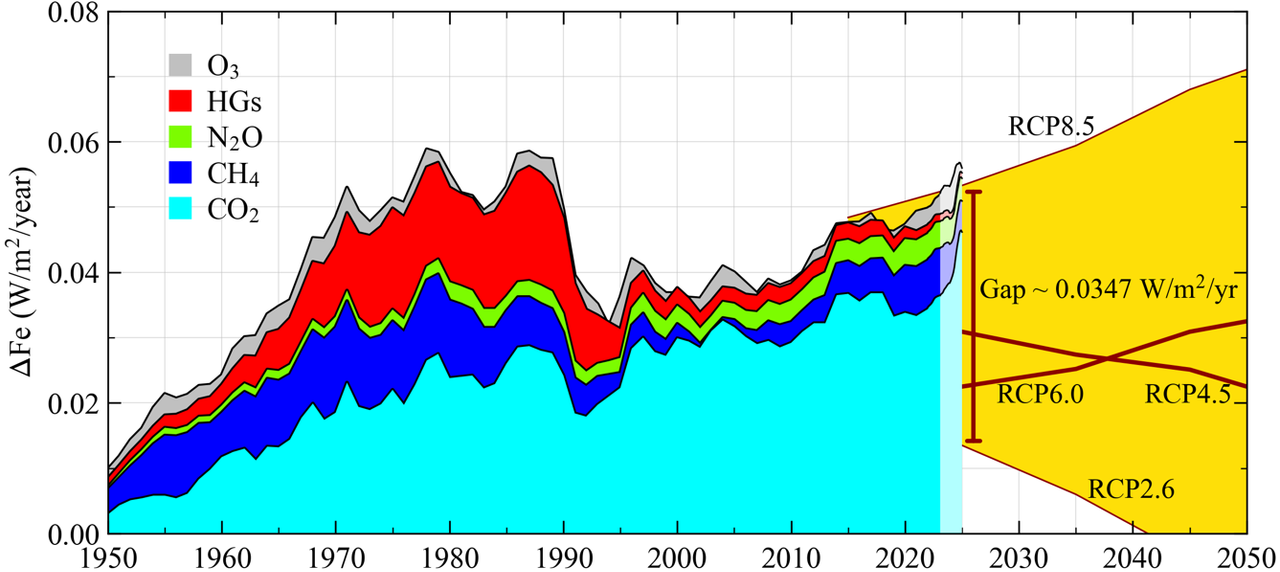
https://www.columbia.edu/~jeh1/mailings/2025/ColorfulChart.21November2025.pdfFig. 1. Annual increase of climate forcing by greenhouse gases.
 Warning! This “Colorful Chart” is Censored by IPCC
21 November 2025
James Hansen, Pushker Kharecha and Dylan MorganAbstract. Our approach to climate analysis places highest priority on data. Climate forcing (see the definition at the end of this communication) by GHGs is a good place to start, as it is the drive for global warming. GHG amounts are well-measured. Our calculated forcings are in close agreement² with those of IPCC and we also agree with IPCC that the uncertainty in absolute GHG forcing is about 10%.³ We show the 60-month (5-year) running-mean of GHG forcing change (Fig. 1) to smooth out short-term variability of sources and sinks of the gases. Thus, results for the last 2.5 years are shaded,…
https://pmatep5f7b.execute-api.us-east-1.amazonaws.com/ProdStage
 = new reply since forum marked as read