Consumer sentiment hits record low, inflation fears rise amid Iran war
Source: CNBC
Published Fri, Apr 10 2026 10:07 AM EDT Updated 12 Min Ago
Consumer confidence plunged to a record low in April as fears mounted over rising energy prices and the broader impact of the Iran war, according to a University of Michigan survey Friday.
The university’s headline index of consumer sentiment tumbled to 47.6, down 10.7% from March to its lowest on record. Current conditions and expectations indexes also saw double-digit monthly declines.
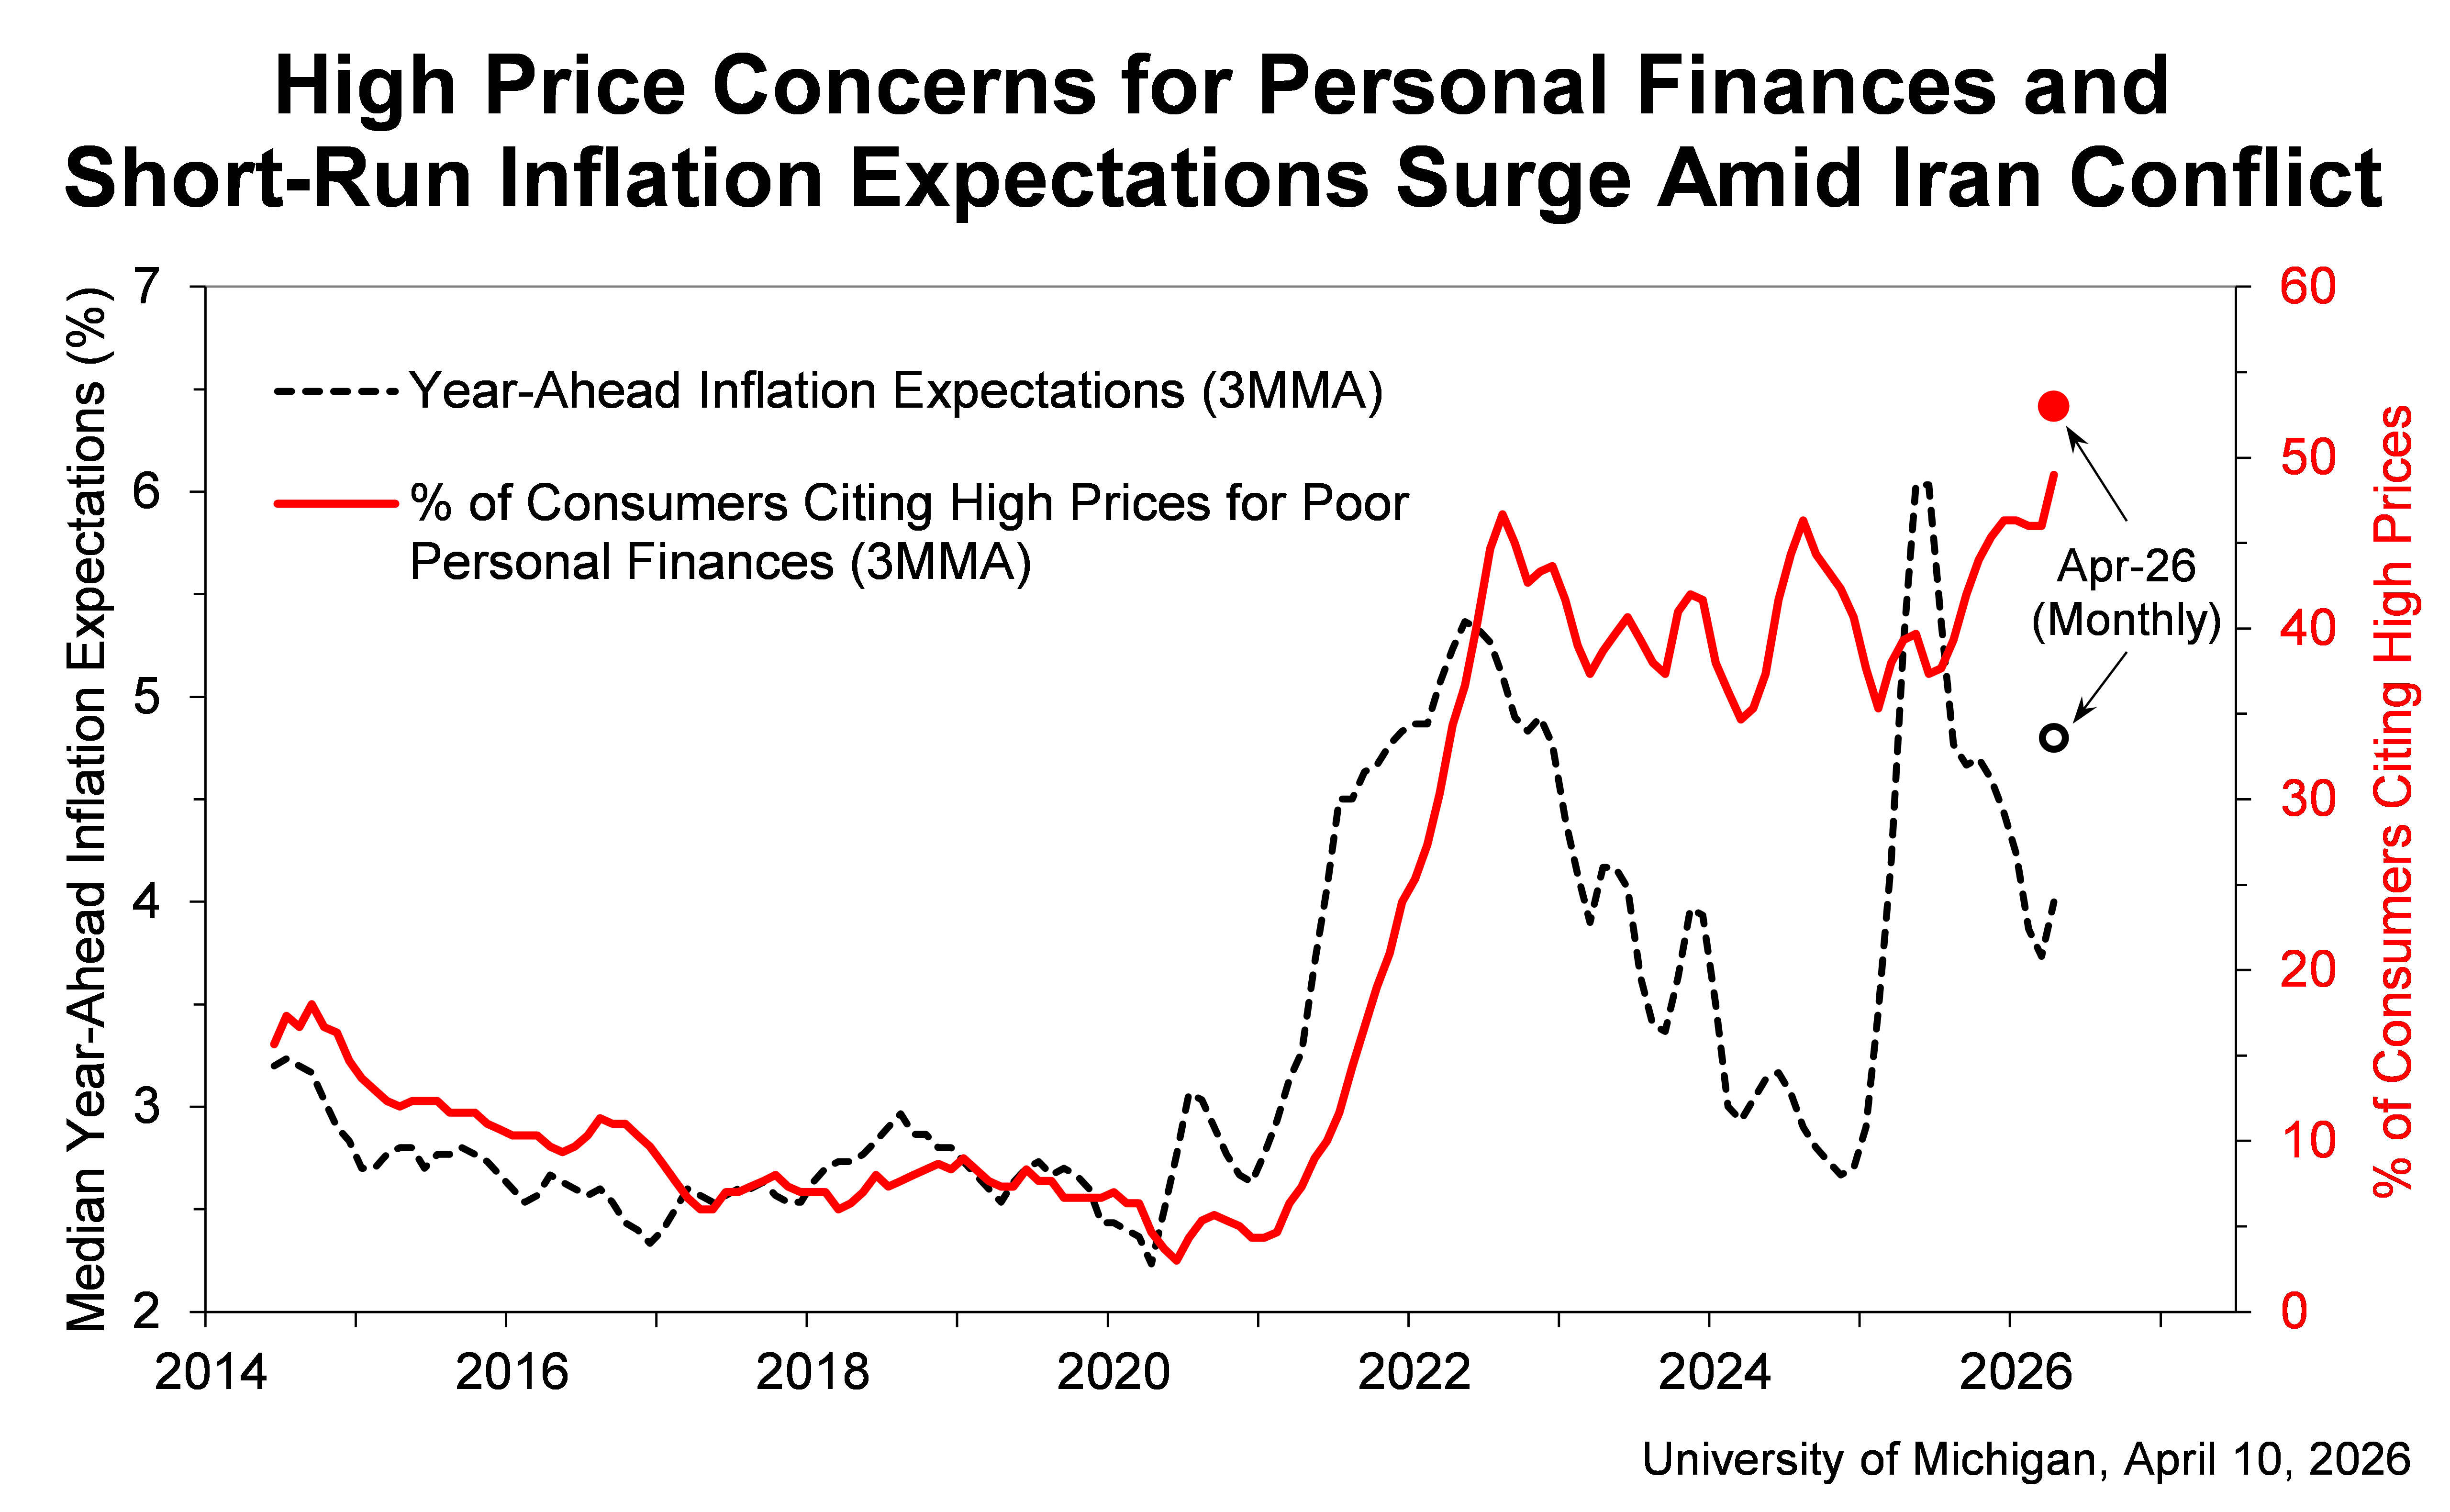
The drop in sentiment coincided with a sharp spike in inflation expectations, with respondents seeing prices up 4.8% in a year from now, a full percentage point rise from the March reading to its highest since August 2025. The one-year outlook in April 2025 was 6.5% following President Donald Trump’s “liberation day” tariff announcement.
Survey comments “show that many consumers blame the Iran conflict for unfavorable changes to the economy,” said survey Director Joanne Hsu. However, Hsu also noted that most of the interviews were completed prior to the April 7 cease fire.
Read more: https://www.cnbc.com/2026/04/10/consumer-sentiment-inflation-fears-iran-war.html
From the source - [link:https://www.sca.isr.umich.edu/Surveys of Consumers]

Article updated.
Previous article -
Consumer outlook plunged to a record low in April as fears mounted over rising energy prices and the broader impact of the Iran war, according to a University of Michigan survey Friday.
The university's headline index of consumer sentiment tumbled to 47.6, down 10.7% from March to its lowest on record. Current conditions and expectations indexes also saw double-digit monthly declines.
The drop in sentiment coincided with a sharp spike in inflation expectations, with respondents seeing prices up 4.8% in a year from now, a full percentage point drop from the March reading to its highest since August 2025.
This is breaking news. Please refresh for updates.
Original article/headline -
Published Fri, Apr 10 2026 10:07 AM EDT
This is breaking news. Please refresh for updates.
 = new reply since forum marked as read
Highlight:
NoneDon't highlight anything
5 newestHighlight 5 most recent replies
= new reply since forum marked as read
Highlight:
NoneDon't highlight anything
5 newestHighlight 5 most recent replies

UpInArms
(55,043 posts)So much winning
ETA:
Year-ahead inflation expectations surged from 3.8% in March to 4.8% this month, the largest one-month increase since April 2025 (see chart, black dashed line and black circle). The current reading exceeds those seen in 2024 and remains well above the 2.3-3.0% range seen in the two years pre-pandemic. Long-run inflation expectations ticked up from 3.2% last month to 3.4% this month, the highest reading since November 2025. In 2024, values ranged between 2.8% and 3.2%, while in 2019 and 2020, they were consistently below 2.8%.
https://www.sca.isr.umich.edu/

FakeNoose
(41,801 posts)I was delighted to find coffee being sold for (discounted) $8.99 for a 12-ounce package yesterday. I think the retailers are finally accepting the fact that Chump's crazy tariffs aren't going to happen. Of course, coffee prices will never return to where they were. But at least they aren't higher each time I walk into the grocery store.


progree
(13,015 posts)
50 YR GRAPH (actually back to about 1960, so 66 years):
https://www.sca.isr.umich.edu/files/chicsh.pdf
The survey of course was before today's hot inflation report ( https://www.democraticunderground.com/10143647448 ). That will cheer them up.

BumRushDaShow
(170,225 posts)for where we are today, compared to periods over the past 6 decades, and showing periods where we know things weren't going well!

(from here - https://www.sca.isr.umich.edu/files/chicsh.pdf)
Looks like it is hovering below where it was back in 1980.
progree
(13,015 posts)BumRushDaShow
(170,225 posts)
(ETA - Paisley Park in your neck of the woods!)
progree
(13,015 posts)I have Windows Power Toys, and one of its applets is "cross hairs" which draws a vertical and a horizontal line through the cursor. With the horizontal line, I can see what's above and below what.
With the vertical line, I can more accurately determine what year an event of interest occurred. Shortcut key for crosshairs is Control Alt P (which I remember as "CAP" ).
I wish I knew how to annotate graphs - I have a limited ability in my Excel graphs. I can't find any capability for that in Imgur, or in Windows Snipping Tool.
BumRushDaShow
(170,225 posts)I just open an image file in Windows Paint (and you can convert any Excel graphs to be images with a "Save as Picture" and I think specify what graphics extension). And then there is a text tool in Paint (where you can set the font type/style/size/color) and just stick the text box where need it and add the text! Volila!
It's cheap, easy, somewhat quick (getting stuff lined up may take some time though) and included.
BumRushDaShow
(170,225 posts)